Палатки для туризма и отдыха
Если Вы ведете динамичный и активный образ жизни, постоянно участвуете в походах или просто любите выбраться с друзьями на уикэнд, тогда для большего комфорта и удобства Вам понадобится туристическая палатка, которая позволит укрыться от дождя или снега, от палящего солнца или от сильного ветра.
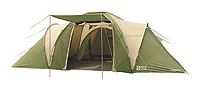
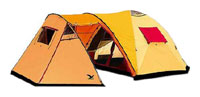
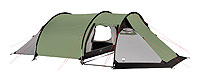
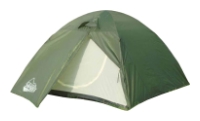
Интернет-магазин «Аltay» предлагает самый полный ряд туристических, кемпинговых или профессиональных альпинистских палаток. Для профессианальных экспедиций Интернет-магазин «Аltay» предлагает специализированные палатки с внешней юбкой для заснеженых вершин, позволяющие сохранять тепло при низких температурах, а для периодических выходов на природу-легкие и простые при сборке туристические палатки.
Здесь Вы найдете подробное описание всех видов палаток. У всех товаров нашего Интернет-магазина есть сертификат качества, а также паспорт, где указана полная характеристика палаток. На нашем сайте представлены только те производители, которые хорошо себя зарекомендовали среди экспертов туристического бизнеса.
Наша компания всегда окажет Вам помощь при выборе палаток. Мы стремимся к максимальному удовлетворению Ваших потребностей и запросов при организации своих приключений.
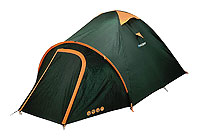
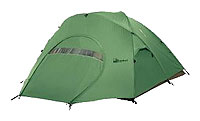
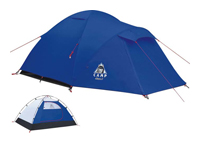
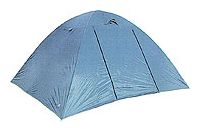
Выбери свою палатку
|